Landmarks
Anatomical landmarks are defined as biologically meaningful loci that can be unambiguously defined and repeatedly located with a high degree of accuracy and precision. The relative location of landmarks provides a spatial map of the relative location of the features that the landmarks represent. Landmark data are useful because there now exist a multitude of methods for the statistical analysis of form using landmark data, but also because more traditional measures like linear distances and angles can be calculated from the landmark data. Traditional anatomical landmarks include foramina for neurovascular bundles, the intersection of sutures and bony processes. Additional landmarks can be defined on the basis of biological knowledge and be used to help identify features that have direct bearing on research questions.
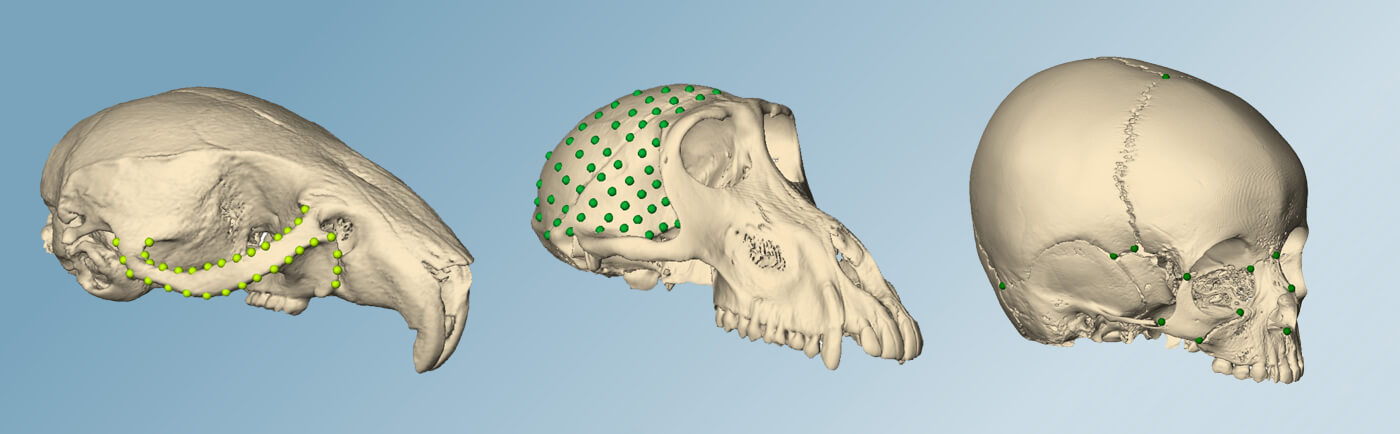
Our lab has spent much time and effort identifying landmarks and conducting measurement error studies on their collection directly from specimens using 3D digitizers, from 3D computed tomographic images, from whole brain magnetic resonance images, micro-computed tomographic images, and micro magnetic resonance images, as well as 3D photogrammatic images.
This page provides a summary of some of this work. Interested readers should also consult publications from the lab.
Landmark List
Click on the links below to view anatomical landmark sets commonly used in the Skeletal Morphogenetics Analysis Laboratory.
Comments about measurement error
The quantitative study of morphology using the 3D coordinates of biological landmarks requires specific attention to measurement error. Your analytical result can only be as good as the data you use in analysis, so measurement error must be studied seriously. We have developed methods for the analysis of measurement error in both 2D and 3D landmark data (e.g., Corner, et al., 1992; Richtsmeier et al., 1995; Valeri et al., 1998; Lele and Richtsmeier, 2001; Williams and Richtsmeier, 2003). The nature of the error study depends upon the tool being used to collect the data. For example, one of our approaches (Richtsmeier et al., 1995) adopted a design that enabled decomposition of the sources of error to those due to the image acquiring system, the operator collecting the data, and to biological variability first. This design was first introduced by Kohn and Cheverud. Methods developed for the evaluation of landmark data must be appropriate to the particular data sets to be collected.
There is a learning curve when beginning to collect landmark data. It is not uncommon for an observer to discard an entire day of work at the beginning of a study. This is because as one looks at more and more specimens, the biological variation around a landmark becomes more well defined by the observer. Consequently, the definition of a landmark might change over the course of data collection. Final data collection commences only after the observer has gone through this process and definitively identified all landmarks. We routinely collect final data twice from each specimen or image, and after a preliminary check for gross errors (e.g., changes in order of landmarks during the collection process, switching left and right-sided landmarks), calculate the average location of each point for analysis. We pay strict attention to measurement error in any study and, if necessary, adjust the methods or the number of data collection trials appropriately in order to minimize measurement error. Validation, precision and repeatability are critical issues that must be addressed when new technology is adopted for a project. Listed above are definitions of landmark sets that we have designed over the past years. Landmarks are only included in an analysis if our estimate of measurement error is acceptable for the proposed study.